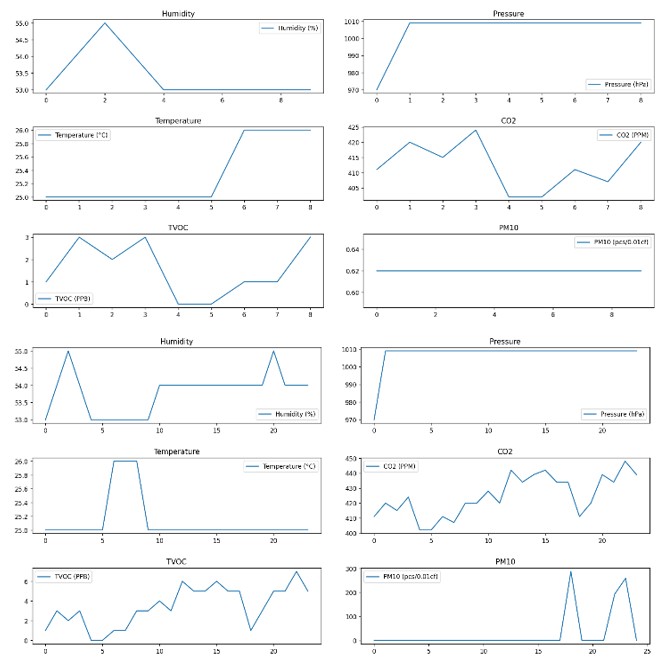
This week our goal is to combine all the codes that we tested individually with each sensor, develop a script for the video presentation for the demo day and the poster, we also focused on developing a method to analyze the output of our prototype. To achieve this, we created graphs that enable visualization of the variations in sensor readings at each moment. These graphs will play a fundamental role in conducting tests and in the subsequent comprehensive analysis of the variation of each component that our prototype measures. To obtain the graphs, we developed Python code that allows us to store the readings of each component in vectors to be used later to draw the curves of each graph. The developed code will undergo changes in the coming weeks as we do not yet have all the necessary sensors. In the following images, we can see what the output of our prototype will look like.