In the 3rd meeting with our project assistant, we confirmed the necessary features for the intermediate delivery - namely the acquisition of pure sinusoids and its representation in both time and frequency domains.
We also discussed with our partners at XLR the possibility of integrating our system with the d&b ArrayCalc software. We decided to get in touch with other companies first, since d&b tends to be less open to external proposals.
We displayed our first spectra and time domain readings with the help of a Matlab code previously prepared by Nuno Jorge. We have yet to calibrate the microphone; once we do that, it should not be a problem for us to present the correct sound intensity values, in dB.
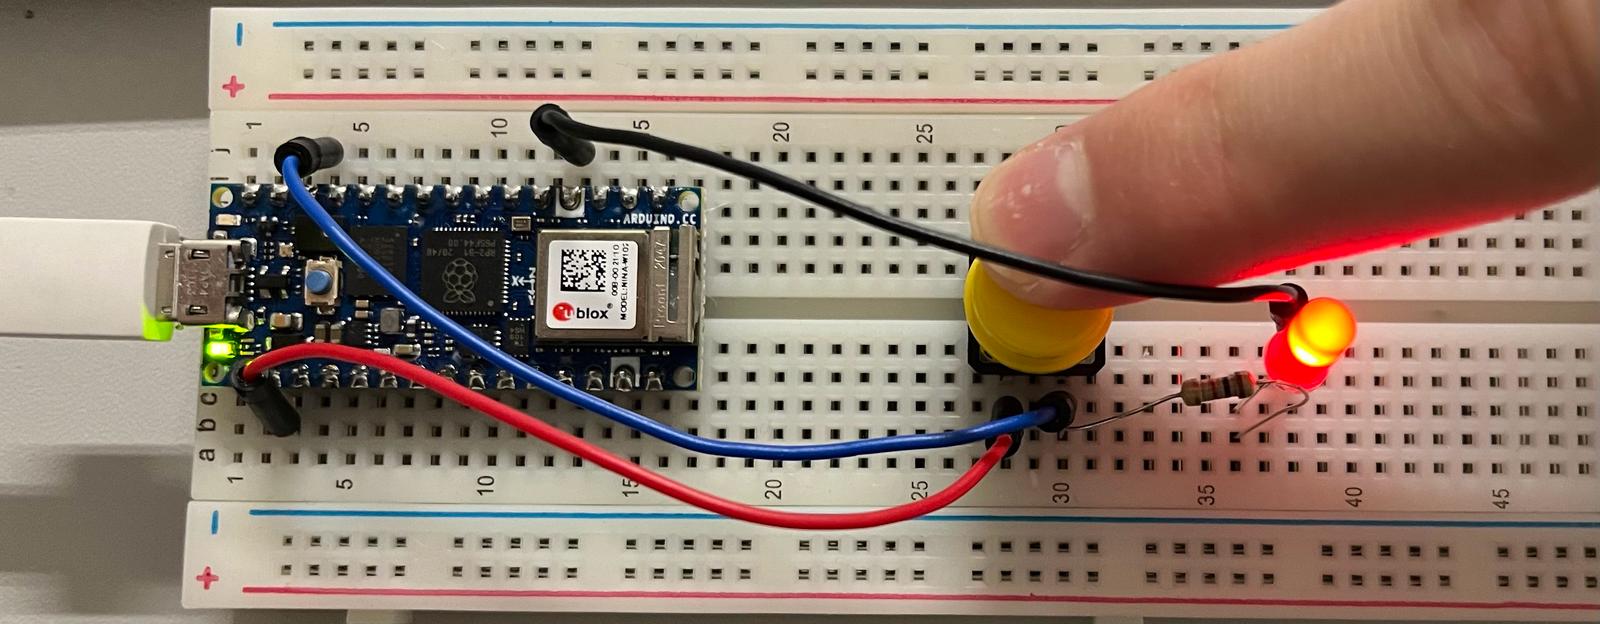
Carlos Reis, Gonçalo Lázaro e Pedro Martins added a button to the prototype; when pushed, it triggers a reading (C++ code running in Arduino). This reading is sent through a microUSB cable with serial communication to a computer running a python script. The first version of this python script, which was written by Carlos Reis, extracted the data to a .csv file to be used by a MATLAB script (for plotting and calculations). The final version of the week plots acquires the data from the port and plots it without using MATLAB.
Nuno Jorge implemented a system to monitor our website’s visits.
Aside from the microphone calibration, our next challenge is setting the adequate sampling frequency for the Arduino. It does not seem to work well when this value is higher than 25 kHz. This is problem, since we need something, at least, slightly above 40 kHz (we must fulfill the Nyquist criterion, taking into account that the audible spectrum ranges from 20 Hz to 20 kHz).