Analytical Model Progress
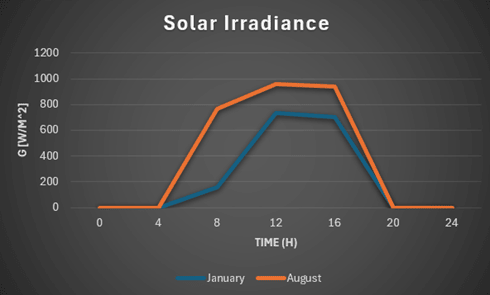
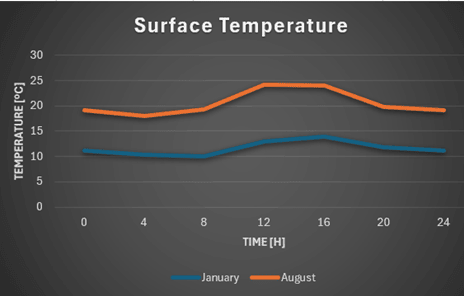
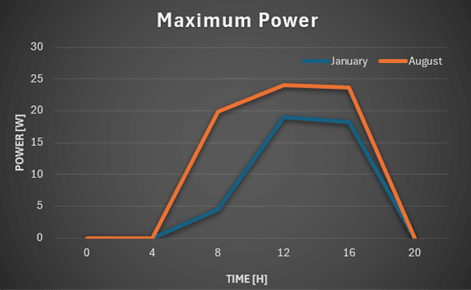
In the week of 18 to 25 of March, we used the data we collected past week to create several graphical representations of temperature, solar irradiance and maximum power of the solar cells as a function of time to help us retrieve some conclusions. For this analysis, we compared the data of these physical quantities in the months of January and August.
Obviously, the surface temperature is higher in August than it is in January and it increases during the day until around one or two in the afternoon. After that, it starts decreasing at about four or five o’clock. It is noticeable that when the temperature is higher, the solar irradiance and the power of the solar cell increase, as expected. However, this reduces the efficiency of the solar cells used.