Source code to accompany the paper:
Discovering Process Models from Unlabelled Event Logs
by Diogo R. Ferreira, Daniel Gillblad
This page contains the source code for the paper entitled
Discovering Process Models from Unlabelled Event Logs
to be presented at the BPM 2009
conference in Ulm, Germany, 7-10 September 2009.
The original source code used to produce the results described
in the paper has been written in C#. In this page we provide a
Python implementation that we hope will be easier to use and
understand.
The package is called Multiple Instance Model (MIM) and the
source code comprises three main files:
mim.py – Contains the Python class model and the routines to
estimate the model parameters, namely the transition matrix M,
the global transition matrix M+ used to initialize M, the source
sequence s, and the separated source sequences y(1…K) that can
be obtained from the symbol sequence x and the source sequence s.
mimest.py – Contains the sample code for creating and estimating
a multiple instance model from a symbol sequence x. The input sequence is read from
standard input with one symbol per line.
mimgen.py – Contains useful code to generate a symbol sequence x
from a distribution of sequences with different probabilities, using
a number of instances and a number of overlapping instances as
specified in the input parameters.
In general, only mim.py and mimest.py will be required. Basically,
mimest.py imports and invokes the mim.py in order to estimate a model.
To test this code one must have a sample symbol sequence x
and therefore mimgen.py is provided as a utility program to generate such sample
sequence. For this purpose, an additional example file is provided:
- example.txt – Contains a sample distribution to be used as input
to mimgen.py in order to create a symbol sequence x that can
given to mimest.py.
Here is a tutorial example on how to use the code:
Start by looking at the contents of example.txt, which basically
contains the behavior that will be used to create the output symbol
sequence x. In each line there is a sequence and its
corresponding probability. These probabilities should add up to 1.0,
but the code in mimgen.py will normalize the distribution even if
this is not the case.
Assuming that Python is installed and available in the system,
open a command line and run:
$ python mimgen.py 20 5 example.txt sequence.txt
In this example, were are asking for a symbol sequence to be generated
from a set of 20 instances (i.e. 20 sequences drawn from the set of
possible sequences found in example.txt) and using a maximum number
of 5 overlapping instances (i.e. at any moment there will be no more
than 5 active instances). The input sequence distribution is to be
read from example.txt and the output symbol sequence x is to be
written to sequence.txt.Check the output that produces mimgen.py on the screen. In this
example, the results could look like something similar to the following
picture. Note that the actual results may differ since mimgen.py is
picking the sequences and interleaving them randomly.

There are different sections in this output. The first couple of lines
display the positions in the symbol sequence. Then the complete symbol
sequence is shown as a sequence of characters.
The middle section with the numbered and dotted
lines contains the sequence of events for each instance, placed at the
position where they occurred. At the end, the symbol sequence is
repeated again for convenience. The two lines before the last show the
source number and these must agree with the line numbers shown in the
left of the figure. The very last line displays a count of the active
sources at each position in the sequence; here it can be seen that the
maximum number of overlapping sources (5) has been achieve twice in
this run.Check the contents of sequence.txt, which contains the symbol sequence
x that has been generated by mimgen.py. In this file there is one
event per line as required by mimest.py. Verify that the sequence in
sequence.txt is the same as the one displayed in the screen output of
mimgen.py.
Run mimest.py on the generated symbol sequence:
$ python mimest.py < sequence.txt
and check the results, which show the transition matrix M and the
distribution of sequences that is obtained from the separated source
sequences y(1…K). The symbols "o" and "x" represent
the special start and stop states, respectively.
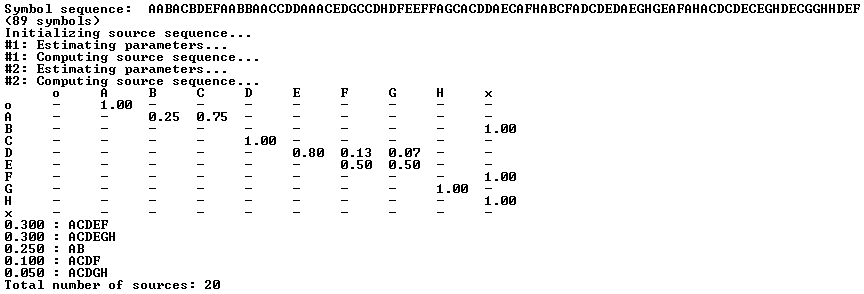
Note that due to imprecise assignments there may be sequences that were
not present in the original log and also the number of detected sources
may differ.Repeat the above steps with different parameters and even different
input sequences and probabilities in example.txt. In general, the higher
the number of instances, the more accurate the results become. The number
of overlapping instances also has some influence in the results, as it
will be easier for the algorithm to discover the original sequences if
this number is low.
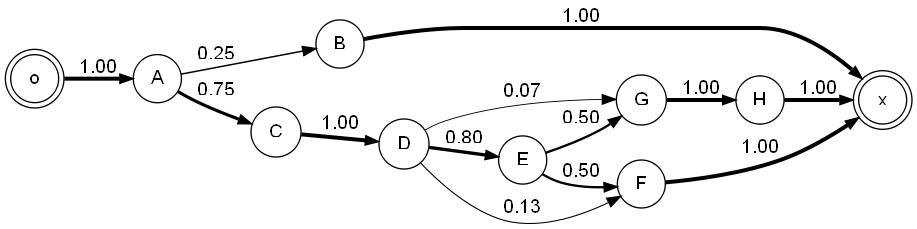
From step 5 above it is possible to use the transition matrix M to
obtain a graphical model such as this one:
In the paper, we introduce the G-metric to compare the behavior of the
estimated model to that of the true model. We also present other results
on the performance and accuracy of the algorithm for different logs and
under different working assumptions.
Summary
-
Download the 4 files:
mim.py,
mimest.py,
mimgen.py and
example.txt.
-
Run: $ python mimgen.py 20 5 example.txt sequence.txt
Try different values for the number of instances and the overlap (in the example above,
the values used were 20 and 5, respectively)
-
Run: $ python mimest.py < sequence.txt
Last modified: 26.05.2009